简体中文
繁體中文
English
Pусский
日本語
ภาษาไทย
Tiếng Việt
Bahasa Indonesia
Español
हिन्दी
Filippiiniläinen
Français
Deutsch
Português
Türkçe
한국어
العربية
Silver Price Analysis: XAG/USD struggles above $23.00, sellers await 200-SMA break
Abstract:In doing so, the bright metal steps back from a two-week high, flashed the previous day, by justifying the strength of a one-month-old horizontal resistance area surrounding $23.25.

Silver retreats from monthly resistance, snaps four-day uptrend.
RSI conditions hints at buyers exhaustion, three-week-old horizontal line adds to the upside filters.
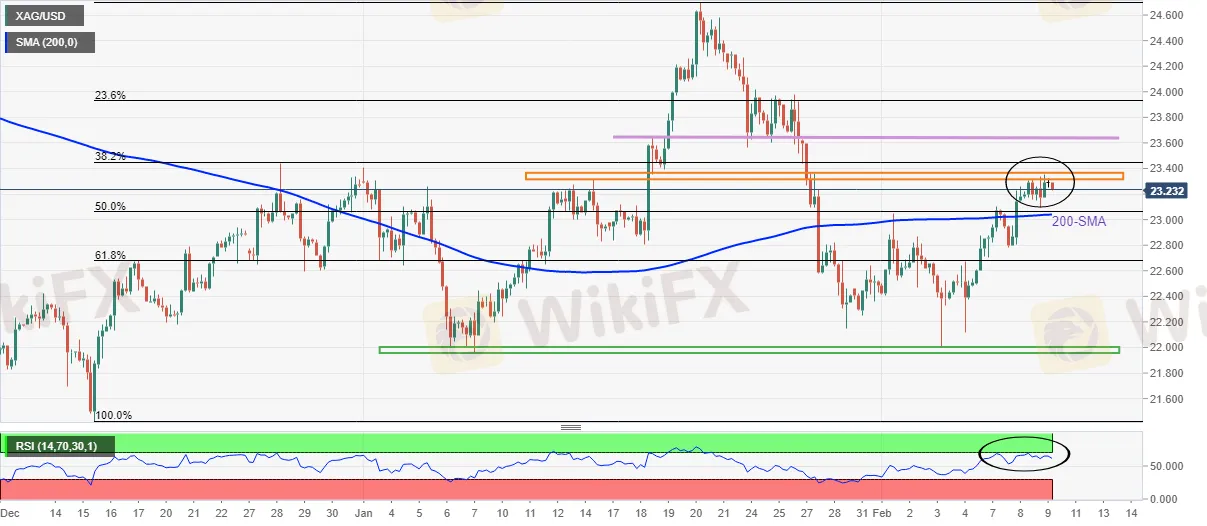
Silver (XAG/USD) consolidates recent gains around $23.20, down 0.26% intraday during Thursdays Asian session.
Also challenging the XAG/USD bulls are the RSI conditions that dont back the recent highs.
Even so, silver sellers need to wait for a clear downside break of the 200-SMA level of $23.00 for fresh entries.
Following that, 61.8% Fibonacci retracement (Fibo.) of December-January upside, close to $22.65, may test the XAG/USD bears before directing them to the five-week-old support area near $22.00.
Meanwhile, recovery moves beyond the immediate hurdle around $23.25 isnt a green card to the silver buyers as a horizontal line from January 18, near $23.65, will challenge the upside moves to the $24.00 threshold.
Should XAG/USD remains firm past $24.00, its run-up towards January‘s high of $24.70 can’t be ruled out.
Silver: Four-hour chart

Disclaimer:
The views in this article only represent the author's personal views, and do not constitute investment advice on this platform. This platform does not guarantee the accuracy, completeness and timeliness of the information in the article, and will not be liable for any loss caused by the use of or reliance on the information in the article.
Read more

What Type of Forex Trader Are You?
Find out what type of forex trader you are—Scalper, Day Trader, Swing Trader, or Position Trader—and discover the tools and strategies that fit you.

Why Hope is Your Worst Enemy in the Stock Market
In the world of equity investing, few forces are as quietly destructive as the investor’s own sense of hope. This psychological trap often known as the "illusion of luck" convinces retail investors that they are among the fortunate few who can defy market logic. More often than not, it ends in losses, disillusionment, and a harsh lesson from the market.

No Recession in Forex? Is Forex Better Than the Stock Market?
As equity markets recently convulse under the pressure of rate uncertainty, geopolitical risk, and weakening macroeconomic signals, an age-old question resurfaces: when the stock market shakes, is it time to look elsewhere?

Why Studying A Lot Doesn’t Work | When Technical Analysis Fails
Technical analysis is the go-to toolkit for countless investors. Candlestick patterns, moving averages, MACD signals, Elliott Waves—you name it, there’s a chart or model for it. Many spend years perfecting their craft, poring over price patterns and back testing strategies. Yet, despite all this effort, a large number still lose money. The reason? It’s not the tools as they’re merely instruments. It’s the human behind them that falters. In particular, wishful thinking and emotional bias often sabotage disciplined execution.
WikiFX Broker
Latest News
Farewell to the Dollar? Forex Market Speeds Toward De-Dollarization
Innovate Finance Extends Congratulations on WikiEXPO’s Success
Institutional Trading Accelerates Amid Market Volatility in Q1 2025
Tariff Headlines Move Markets: What Every Forex Trader Should Know
Why Joining an Online Trading Community is Essential for Success
Southeast Asia Cracks Down on Scam Centers: Human Trafficking and Fraud Exposed
No Recession in Forex? Is Forex Better Than the Stock Market?
Why Hope is Your Worst Enemy in the Stock Market
What Type of Forex Trader Are You?
Lithuania Fines Revolut €3.5M for Money Laundering Failures
Currency Calculator


