简体中文
繁體中文
English
Pусский
日本語
ภาษาไทย
Tiếng Việt
Bahasa Indonesia
Español
हिन्दी
Filippiiniläinen
Français
Deutsch
Português
Türkçe
한국어
العربية
FPG AUS200 Market Report April 9, 2025
Abstract:AUS200 is currently in a strong bearish correction, with price traded around 7421.10, significantly below the key resistance at 7920.28. Although theres a visible rebound from the 7209.32 support zone
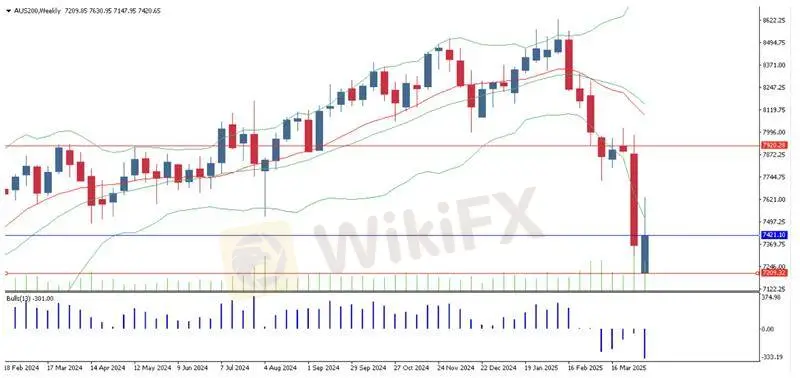
AUS200 is currently in a strong bearish correction, with price traded around 7421.10, significantly below the key resistance at 7920.28. Although theres a visible rebound from the 7209.32 support zone, the long-term structure remains under pressure following a multi-week selloff, pushing the index well below its moving averages and expanding Bollinger Bands to the downside.
After a sharp bearish breakdown in mid-March 2025, the index found temporary support at 7209.32, triggering a mild bounce. However, the price remains below the midline of the Bollinger Bands and the 20-week moving average, indicating a continuation of bearish pressure. The Bollinger Bands are widening, a classic sign of rising volatility and continuation potential of the downtrend.
Bulls Power (13) currently reads at -301.00, signaling continued dominance of bearish sentiment. Volume has slightly increased on the latest bullish candle, which may suggest profit-taking or a minor retracement, rather than a trend reversal. The overall structure shows lower highs and lower lows, keeping the bearish trend intact on the weekly timeframe.
Market Observation & Strategy Advice:
1. Key Resistance Level: 7920.28 – A decisive weekly close above this zone is needed to confirm trend reversal.
2.Current Position: 7421.10 – Price is retracing within a bearish context; this could be a dead cat bounce.
3. Support Level: 7209.32 – Critical support; a break below would open further downside toward the 7000 psychological zone.
4. Momentum Indicator: Bulls Power at -301.00 indicates weak bullish attempts and prevailing bearish momentum.
5. Trading Strategy: Bearish setups remain favored below 7421.10, with short opportunities targeting 7209.32 and stops above 7550; a bullish reversal requires strong close above 7920.28, ideally with rising volume and positive divergence.
Market Performance:
Index Last Price % Change
S&P 500 4,982.77 -1.57%
Dow Jones 37,645.59 -0.84%
Nasdaq 15,267.91 -2.15%
Todays Key Economic Calendar:
JP: Consumer Confidence
US: MBA 30-Year Mortgage Rate
US: FED Barkin Speech
Risk Disclaimer This report is for informational purposes only and does not constitute financial advice. Investments involve risks, and past performance does not guarantee future results. Consult your financial advisor for personalized investment strategies.
Disclaimer:
The views in this article only represent the author's personal views, and do not constitute investment advice on this platform. This platform does not guarantee the accuracy, completeness and timeliness of the information in the article, and will not be liable for any loss caused by the use of or reliance on the information in the article.
WikiFX Broker
Latest News
SkyLine Guide 2025 Malaysia: 100 Esteemed Judges Successfully Assembled
 WikiFX
Vantage Markets Review 2025: Trusted Forex and CFD Trading Since 2009
WikiFXWhy STARTRADER Is Popular Among Traders?
WikiFXA Guide to Intraday Forex Trading You Can't Miss Out
WikiFXCONSOB Blocks Access to 13 Unauthorized Investment Websites
WikiFXTradingPRO: A Closer Look at Its Licences
WikiFXThe world could be facing another ‘China shock,’ but it comes with a silver-lining
WikiFXNew SEBI Regulations on Intraday Trading
WikiFXEverything You need to know about Barath Trade
WikiFXIronFX Broker Review 2025: A Comprehensive Analysis of Trustworthiness and Performance
WikiFXCurrency Calculator

