简体中文
繁體中文
English
Pусский
日本語
ภาษาไทย
Tiếng Việt
Bahasa Indonesia
Español
हिन्दी
Filippiiniläinen
Français
Deutsch
Português
Türkçe
한국어
العربية
Stagflation Fears and Dollar Rebound Weigh on Gold: Structural Concerns Emerge
Abstract:On Thursday, May 22, the U.S. Dollar Index snapped a three-day losing streak with a sharp rebound, driven by a confluence of macroeconomic catalysts. Chief among them was the House‘s passage of Presid
On Thursday, May 22, the U.S. Dollar Index snapped a three-day losing streak with a sharp rebound, driven by a confluence of macroeconomic catalysts. Chief among them was the House‘s passage of President Trump’s “Big and Beautiful” bill — a sweeping package of tax cuts and fiscal stimulus — which fueled expectations of increased government spending and lifted the dollar.
Meanwhile, the eurozone‘s economic data came in unexpectedly weak. The services PMI dropped to a 16-month low, and although manufacturing showed a modest uptick, the overall downward trend remains intact. The ECB’s latest meeting minutes signaled that inflation is “nearing its end,” prompting markets to price in a 90% probability of a rate cut in June, with a further reduction potentially bringing the deposit rate down to 1.75% by year-end. These expectations are exerting systemic pressure on the euro and driving relative dollar strength.
1. Underlying Risks in the U.S. Economy
While the dollar was buoyed in part by stronger-than-expected May PMI data, underlying structural issues warrant caution. According to S&P Global:
Manufacturing PMI (Prelim): 50.9 (vs. prior 50.0)
Services PMI (Prelim): 54.8 (vs. prior 51.3)
Composite PMI: 54.4 — marking a second consecutive month of expansion
Beneath the surface, however, cost pressures are mounting. Input prices surged to 63.4, the highest since 2022, while selling prices jumped to 59.3. Alarmingly, service exports plunged — the steepest drop since the pandemic — and manufacturing delivery times stretched to a 31-month high. These signs all point to a clear trend: cost-push inflation is once again dominating the inflation landscape.
Such dynamics are classic precursors to stagflation: rising prices amid faltering exports, supply chain strains, and production bottlenecks. Should this trend persist, the Fed may face an increasingly difficult balancing act.
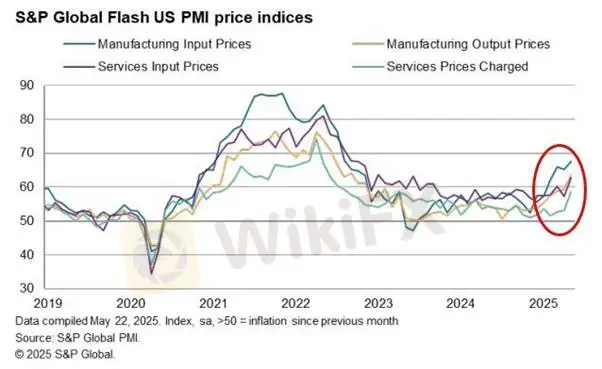
[Chart: S&P Global U.S. PMI – Source: Markit]2. Bond Market Warning: Yield Curve Steepens
The bond market is echoing these stagflation concerns. A rare divergence has emerged: short-end Treasury yields are supported by improving labor data (initial jobless claims fell to 227,000), while long-end yields are rising due to concerns about ballooning government debt.
The 30-year Treasury yield hit a 19-month high, fueled by a $3.8 trillion supply surge and weakening demand for long-dated issuance. Wednesdays 20-year bond auction saw higher-than-expected yields, suggesting structural demand weakness. As CreditSights analyst Zachary Griffiths noted, “The long-end demand curve for sovereign debt is shifting. Traditional buyers are pulling back.”
This kind of asymmetric steepening in the yield curve often signals fractured market expectations — a hallmark of stagflationary regimes.
Conclusion: A Structural Repricing, Not a Sentiment Shift
The current divergence in market views is not merely sentiment-driven; it reflects a broader structural repricing. From U.S. fiscal stimulus and ECB dovishness to resurging U.S. inflation and bond market realignment, the market is entering a transitional phase. Amid rising stagflation risks and shifting policy expectations, investors must prioritize structural risk hedging over short-term speculation.
While gold has experienced a pullback, its medium-to-long-term thesis remains intact, supported by sovereign debt concerns and the potential for negative real rates. Going forward, close attention should be paid to Treasury auctions, inflation composition, and evolving Fed guidance to reassess golds fair value dynamically.
Gold Price Outlook

Following a pullback from the recent high of $3,308, gold has shown stable support, suggesting initial profit-taking pressures have been absorbed. While short-term safe-haven demand has cooled, the overall uptrend remains intact. The Relative Strength Index (RSI) is gently correcting and remains above the neutral 50 level, indicating that momentum has softened but not reversed.
As long as RSI holds above 50, the bullish trend stays in play. Near-term focus lies on the $3,290–$3,300 support zone. A successful hold could pave the way for a retest of the $3,350 resistance level. Conversely, a breakdown could open the door for a further decline toward $3,250.
Resistance: $3,350/oz
Support: $3,290–$3,300, $3,248, $3,220/oz
Risk Disclaimer: The views, analyses, research, pricing, or other information presented above are for general market commentary purposes only. They do not represent the platforms official stance. All readers should exercise their own judgment and trade responsibly.
Disclaimer:
The views in this article only represent the author's personal views, and do not constitute investment advice on this platform. This platform does not guarantee the accuracy, completeness and timeliness of the information in the article, and will not be liable for any loss caused by the use of or reliance on the information in the article.
WikiFX Broker
Latest News
Crypto News: $1 Trillion Managed Funds Fail Key Compliance Tests
 WikiFX
No worries — You can invest with these offshore regulated brokers
WikiFXHe Thought It Was an Investment, Now RM900,000 Is Gone
WikiFXTiger Brokers Q1 2025 Profit Soars Amid Growing Online Trading Volume
WikiFXATFX Secures Cambodia License, Boosting Forex, and Crypto Trading Growth
WikiFXMetaTrader Access Disruptions Shake Chinese Forex Traders and Brokers
WikiFXUSD/JPY Under Pressure Again as Market Sentiment Wavers
WikiFXTitan FX Launches Research Hub to Support Informed Trading
WikiFXDon't fall for these Brokers
WikiFXSEBI bans famous Bollywood, Actor Arshad Warsi & Others
WikiFXCurrency Calculator

