简体中文
繁體中文
English
Pусский
日本語
ภาษาไทย
Tiếng Việt
Bahasa Indonesia
Español
हिन्दी
Filippiiniläinen
Français
Deutsch
Português
Türkçe
한국어
العربية

FPG UK100 Market Report June 4, 2025
Zusammenfassung:UK100 continued its bullish trajectory, maintaining a tight upward channel. The index around 8789.45, showing signs of temporary consolidation below a significant resistance at 8841.42. Bullish moment
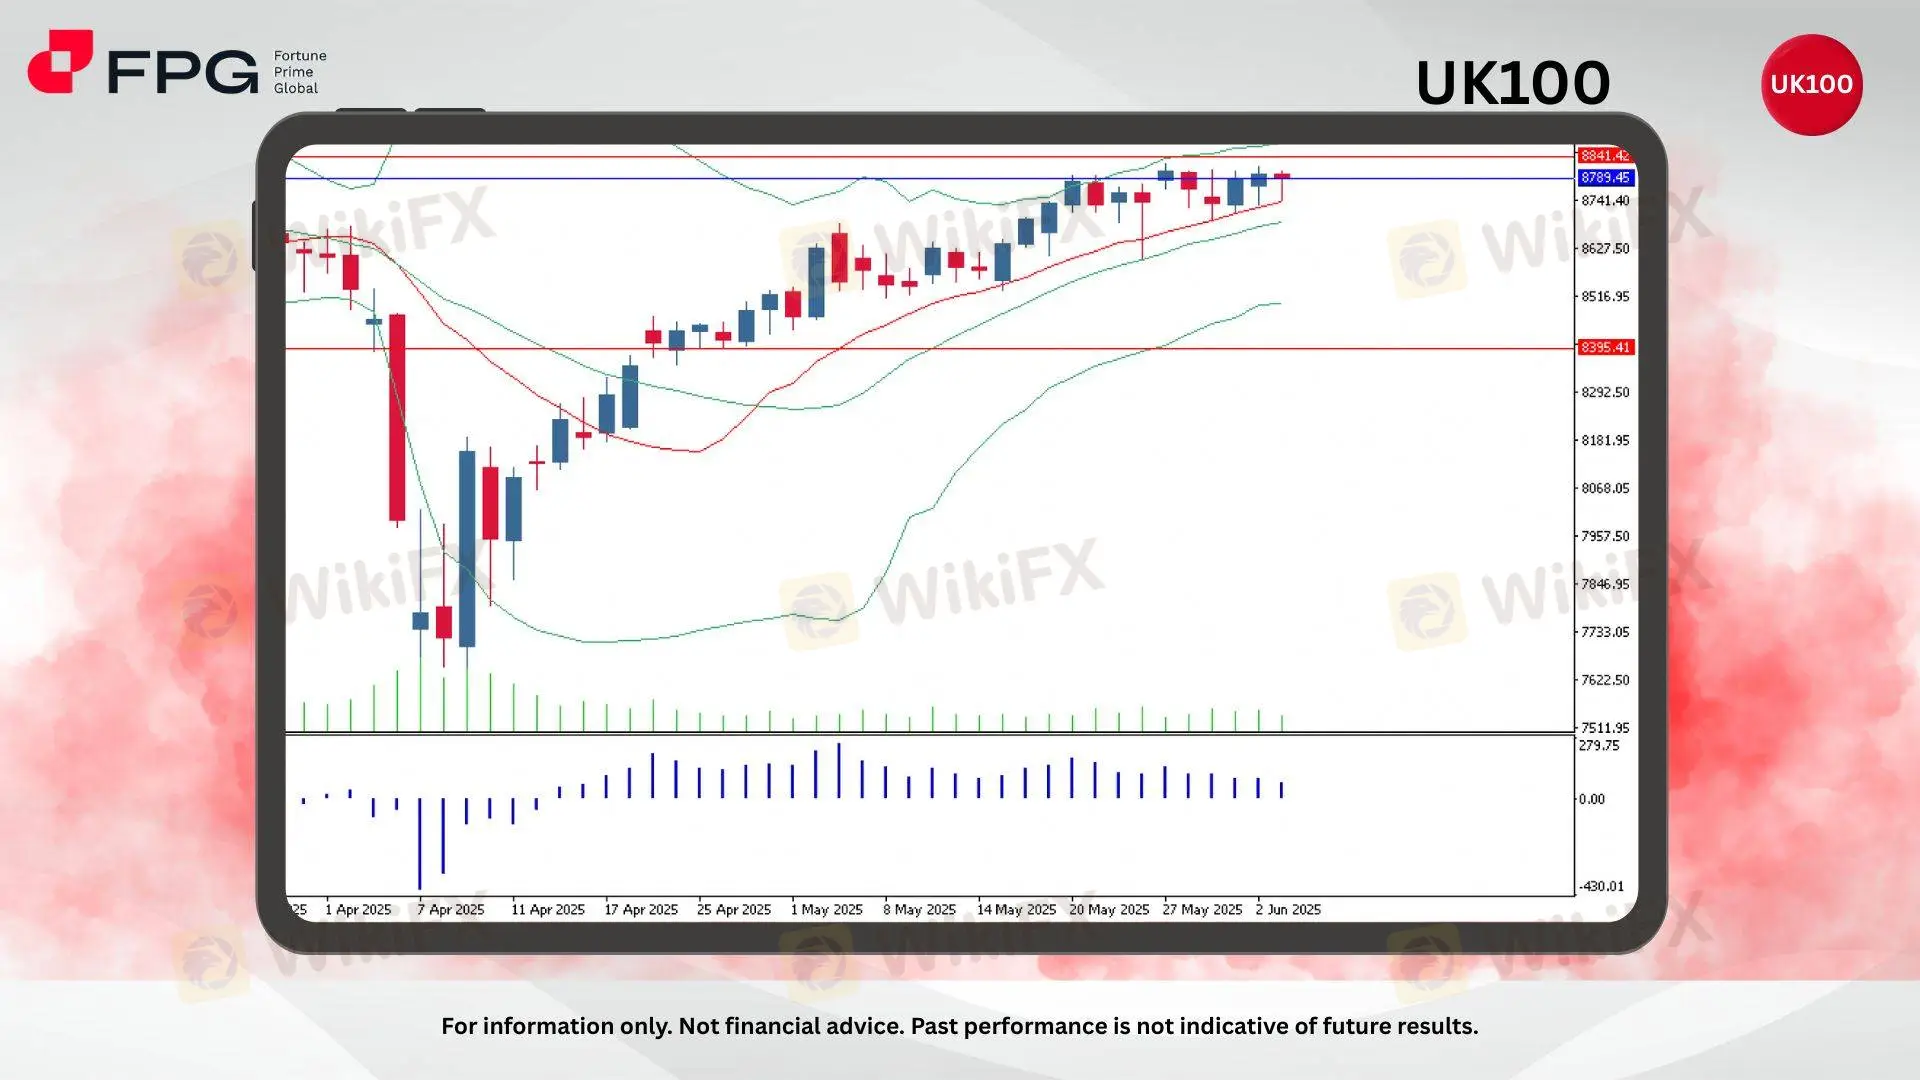
UK100 continued its bullish trajectory, maintaining a tight upward channel. The index around 8789.45, showing signs of temporary consolidation below a significant resistance at 8841.42. Bullish momentum remains intact, but short-term price compression suggests a possible breakout or pullback scenario.
Price action is riding the upper Bollinger Band, reflecting persistent upward pressure, while the middle band (20-day SMA) acts as dynamic support. The Bulls Power indicator is at 74.14, confirming strong buyer dominance. Price remains well above the 10- and 20-day EMAs, which are aligned in a bullish configuration and supporting the uptrend. However, the shrinking daily candles and proximity to the 8841.42 resistance indicate weakening momentum.
Support is clearly defined at 8395.41, where a cluster of previous consolidation occurred. Any downside pullback toward this level may serve as a healthy correction if not accompanied by volume spikes. The tight Bollinger Band squeeze that preceded the recent move upward may be setting the stage for another volatility expansion.
Market Observation & Strategy Advice:
1. Resistance Level: 8841.42 remains the key ceiling. A confirmed breakout above it may accelerate bullish continuation.
2. Support Level: 8395.41 serves as a strong base; price bouncing from this level previously triggered renewed bullish strength.
3. Bulls Power: At 74.14, still firmly in positive territory, indicating buying pressure remains active, but plateauing.
4. Price Structure: Tight consolidation near upper band with lower volatility hints at an imminent directional move.
5. Trading Strategy Suggestions:
Bullish Bias: Consider breakout trades if price closes decisively above 8841.42 with increased volume.
Cautious Longs: Look for long entries on pullbacks to EMA or mid-Bollinger support (~8650–8700) with bullish confirmation.
Risk Management: Set stop-losses below 8395.41 if entering near current levels to manage pullback risk effectively.
Market Performance:
Index Last Price % Change
S&P 500 5,970.37 +0.58%
Dow Jones 42,519.64 +0.51%
Todays Key Economic Calendar:
AU: GDP Growth Rate QoQ
CA: BoC Interest Rate Decision
US: ISM Services PMI
Risk Disclaimer: This report is for informational purposes only and does not constitute financial advice. Investments involve risks, and past performance does not guarantee future results. Consult your financial advisor for personalized investment strategies.
Haftungsausschluss:
Die Ansichten in diesem Artikel stellen nur die persönlichen Ansichten des Autors dar und stellen keine Anlageberatung der Plattform dar. Diese Plattform übernimmt keine Garantie für die Richtigkeit, Vollständigkeit und Aktualität der Artikelinformationen und haftet auch nicht für Verluste, die durch die Nutzung oder das Vertrauen der Artikelinformationen verursacht werden.
WikiFX-Broker
Aktuelle Nachrichten
20 Prozent in einem Monat – Diese vier Impulse befeuern jetzt Nvidias Rekord-Rückkehr
 WikiFX
Europäische Zentralbank senkt Leitzins auf 2,0 Prozent
WikiFXDie Zahl der Millionäre in Deutschland ist geschrumpft – in diesen Regionen der Welt ist die Zahl der Reichen gestiegen
WikiFXWas hinter den günstigen Preisen für Benzin und Diesel steckt – und wie lange Sprit noch billiger bleibt
WikiFXWechselkursberechnung

